Plotting Level 2 Data
PyDIVIDE is currently in a strange place right now, and in the future may further depend on PySPEDAS or even become a part of that library. Currently, we have only one routine to display level 2 data.
Additional Requirements
All level 2 data plotting routines will rely on PySPEDAS for loading the data into memory (into xarrays). This library can be installed via
pip install pyspedas
Full Plots
This routine was created as a way to uniquely visualize the MAVEN data, as well as display the capabilities of PySPEDAS and PyTplot. Currently, it only works with the pyqtgraph visualization library, but hopefully a bokeh window will be added in the future.
If you would like the fully interactive 3D window to appear, you must first run
pip install pyopengl
-
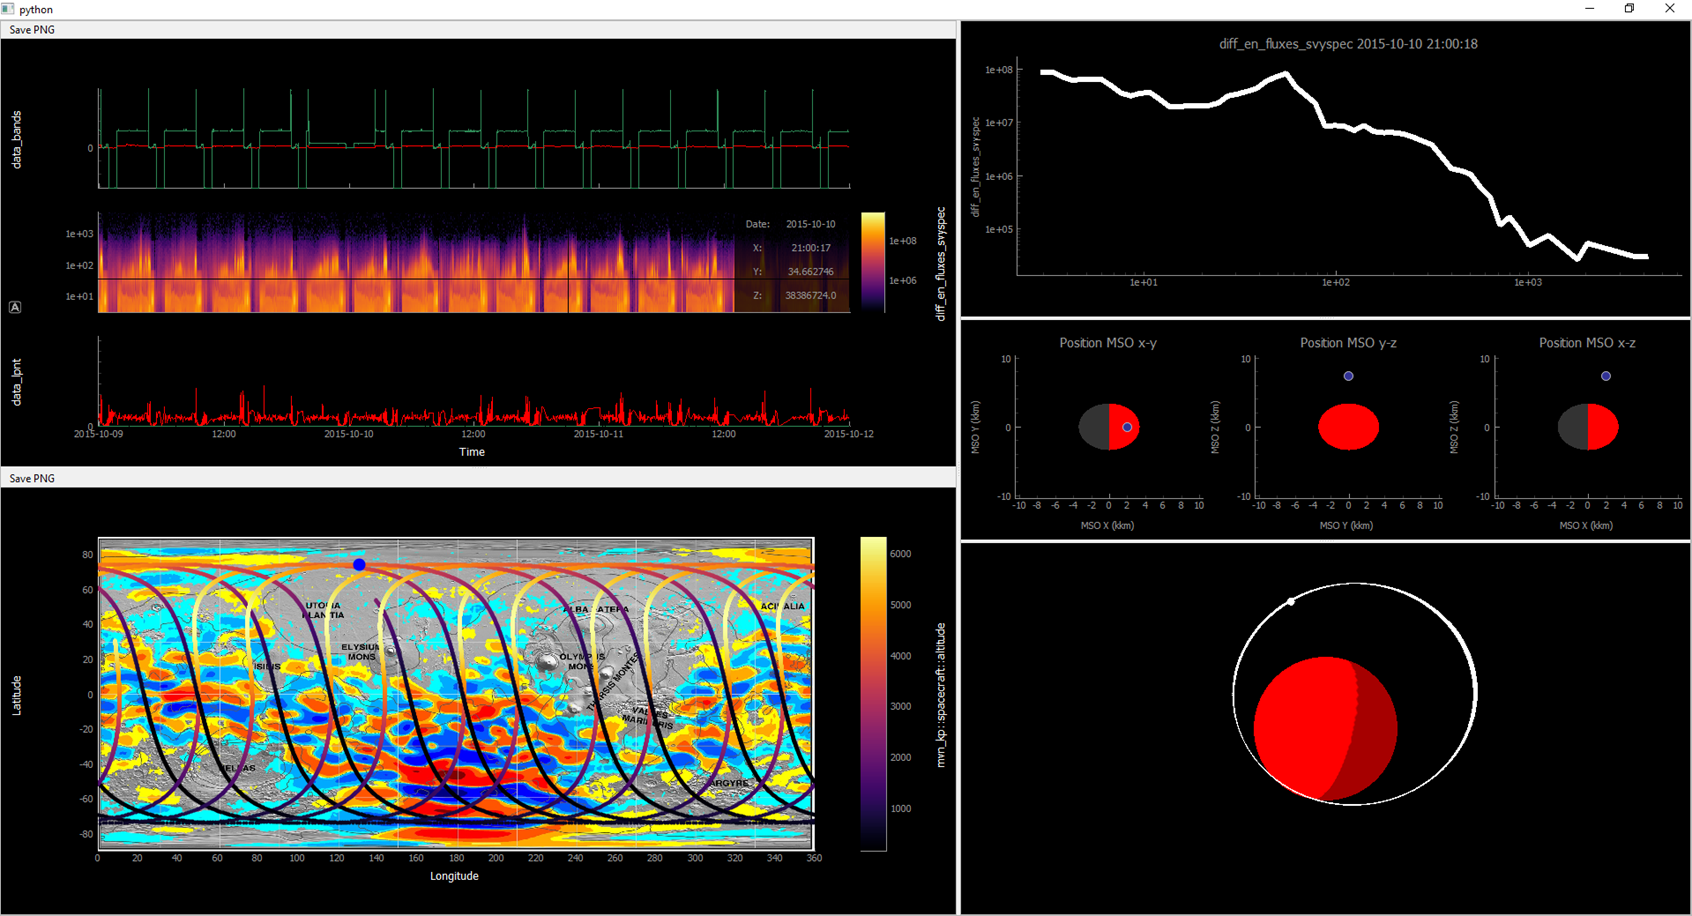
pydivide.fullplot(instruments=None, level='l2', type=None, start_date='2014-01-01', end_date='2014-01-02', tplot_names='', filenames=None, insitu=None, parameter='', auto_yes=True)[source]¶ Plot any insitu Level 2 or KP data from MAVEN. Downloads files found into PySPEDAS and loads them into memory via PyTplot. Then creates an interactive plot window including spectrogram slicer, MAVEN’s location and orbit in MSO coordinates, and MAVEN’s location in GEO coordinates, especially relative to the crustal magnetic fields.
Parameters: - instruments – str/list of str Instruments from which you want to download data. Accepted values are any combination of: sta, swi, swe, lpw, euv, ngi, iuv, mag, sep, rse
- type – str/list of str The observation/file type of the instruments to load. If None, all file types are loaded. Otherwise, a file will only be loaded into tplot if its descriptor matches one of the strings in this field. See the instrument SIS for more detail on types.
- tplot_names – list of str The tplot names to plot. Also not needed, use only if the variables are already loaded into memory. For example, if you want to load in data with this fullplot procedure but modify the variables with pytplot.options or the pytplot.tplot_math routines, you can re-plot the data by specifying the specific pytplot variables.
- filenames – str/list of str [‘yyyy-mm-dd’] List of files to load
- start_date – str String that is the start date for downloading data (YYYY-MM-DD), or the orbit number
- end_date – str String that is the end date for downloading data (YYYY-MM-DD), or the orbit number
- kp – dict insitu kp data structure/dictionary read from file(s). This is not required, only needed if you want to plot variables from this data structure.
- parameter – list of str/int If the above kp data structure is given, this variable will be the parameters to plot (see the pydivide.plot function)
- Types:
- Returns :
- None
Examples
>>> # Plots EUV Bands, LPW LP-IV, and MAG SS data on Jan 01 2015
>>> pydivide.fullplot(instruments=['euv', 'lpw', 'mag'], type=['bands', 'lpnt', 'ss1s'], start_date='2015-01-01', end_date='2015-01-02')